
Pobierz aplikację
-
- Platformy handlowe
- Aplikacja PU Prime
- MetaTrader 5
- MetaTrader 4
- PU Copy Trading
- Trader Web
- PU Social
-
- Warunki Handlowe
- Typy kont
- Spready, Koszty i Swap
- Depozyty i Wypłaty
- Opłaty i Koszty
- Godziny Handlu

Pobierz aplikację

Wall Street slid as well as the Asian stock markets as the worries over the debt ceiling escalated when the time was getting closer to the X-date. Meanwhile, the dollar strengthened to its highest level since March as the latest FOMC meeting minutes showed a portion of Fed officials supporting more rate hikes to tame inflation. Additionally, credit rating agencies’ warnings of a potential U.S. credit rating downgrade further bolstered the dollar’s strength, as higher bond yields may attract currency appreciation. On the other hand, oil prices continued their upward trajectory, fueled by OPEC+’s threat to counter short-sellers. Moreover, an unexpected significant drop in U.S. crude stockpiles provided further support, propelling oil prices to their highest level in May.
Current rate hike bets on 14th June Fed interest rate decision:
Source: CME Fedwatch Tool
0 bps (66%) VS 25 bps (34%)


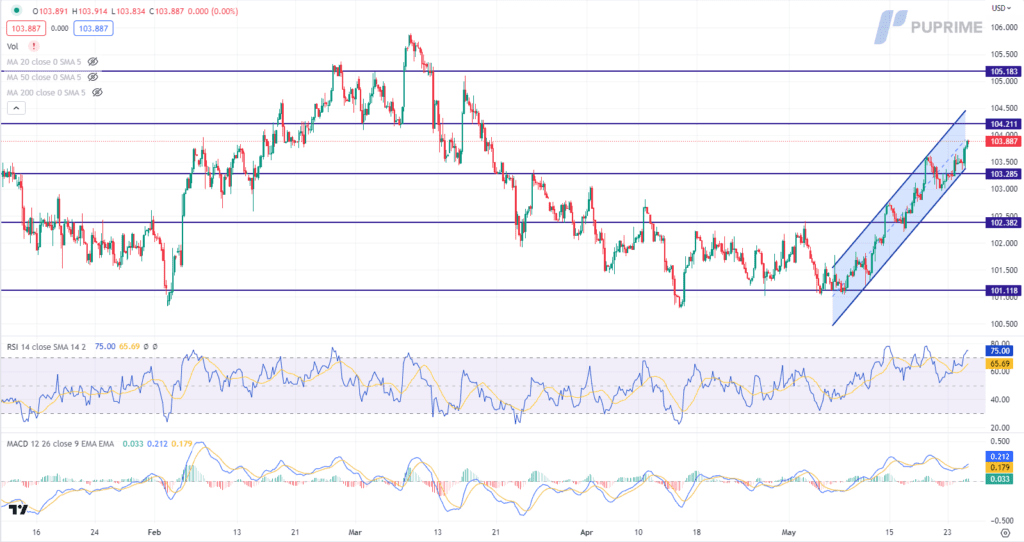
The US Dollar advanced as a safe-haven asset amidst growing market uncertainties triggered by both the release of the FOMC meeting minutes and the impasse in debt ceiling negotiations. The minutes highlighted a substantial divergence in views among Federal Reserve officials regarding future rate hikes. While some policymakers advocate for additional tightening, others anticipate a potential economic slowdown that could render further monetary policy tightening unnecessary. Consequently, the Fed seems inclined towards a data-dependent approach, prompting investors to closely monitor US economic indicators and the progress of debt ceiling talks for potential trading cues.
The Dollar Index is trading higher following the prior breakout above the previous resistance level. MACD has illustrated increasing bullish momentum. However, RSI is at 75, suggesting the index might enter overbought territory.
Resistance level: 104.20, 105.20
Support level: 103.30, 102.40
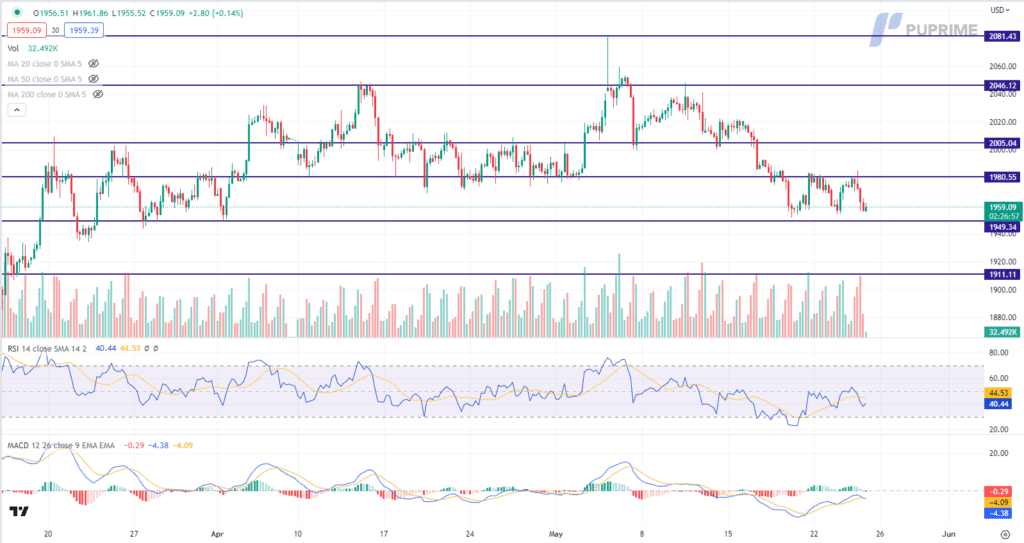
Gold prices retreated as the US Dollar gained strength, reflecting market participants’ inclination towards a more hawkish stance from the Federal Reserve, despite the FOMC meeting minutes revealing a divergence of opinions on future rate hikes. The mixed views expressed by Fed officials have left investors uncertain about the path ahead. Currently, market participants anticipate a 35.3% probability of a rate hike during the upcoming June FOMC meeting, slightly higher than the previous expectation of 30%, according to CME Group’s FedWatch tool.
Gold prices are trading lower while currently near the support level. MACD has illustrated increasing bearish momentum, while RSI is at 40, suggesting the commodity might extend its losses after successfully breakout below the support level since the RSI stays below the midline.
Resistance level: 1980.00, 2005.00
Support level: 1950.00, 1910.00

The euro couldn’t stay above its crucial support level and continued to trade in a bearish momentum since early this month. The euro was hammered by the strengthened dollar, which was encouraged by the latest FOMC meeting minutes. The meeting minutes showed that the Fed officials have split decisions over future rate hikes decisions where some of the officials are supporting the view of more rate hikes to tame inflation. On top of that, credit rating companies warn to cut U.S. credit rating may drive the dollar higher as higher bond yields and risk aversion may support the dollar to trade higher.
The euro has broken below its crucial support level at 1.0765 which suggests the EUR/USD pair is trading in a downtrend channel. The RSI is moving toward the oversold zone while the MACD is moving flat, depicting a lack of bullish momentum for the pair.
Resistance level: 1.0765, 1.0850
Support level: 1.0680, 1.0614
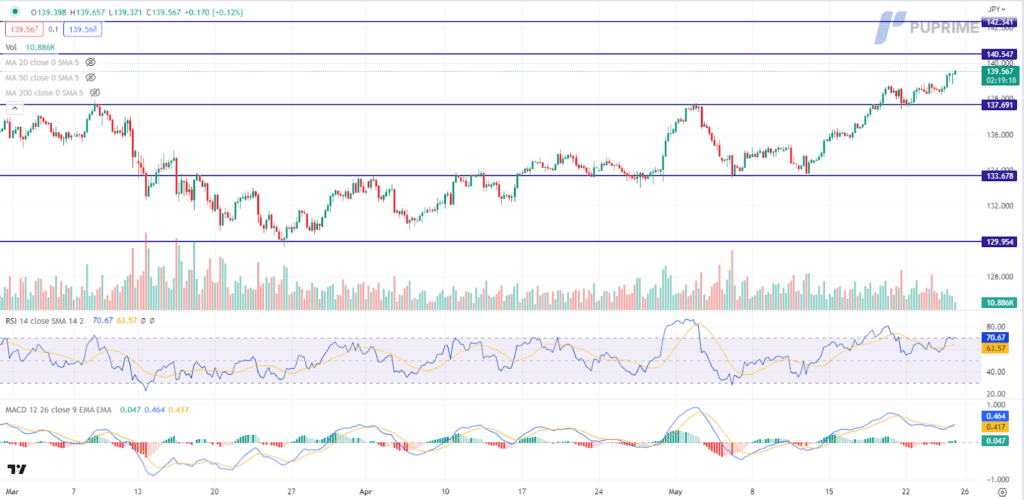
The Japanese Yen continued its downward trajectory against the US Dollar, weighed down by the persistent rise in US Treasury yields, which has resulted in a significant yield divergence between the two countries. The upcoming release of the US Core PCE Deflator on Friday poses a crucial risk for the Japanese Yen, as it serves as the Federal Reserve’s preferred inflation gauge. Any indications of potential rate hikes in the US are expected to widen the yield spread even further, intensifying the uncertainties surrounding the Japanese Yen.
USD/JPY is trading higher following the prior breakout above the previous resistance level. MACD has illustrated increasing bullish momentum. However, RSI is at 71, suggesting the pair might enter overbought territory.
Resistance level: 140.55, 142.35
Support level: 137.70, 133.70
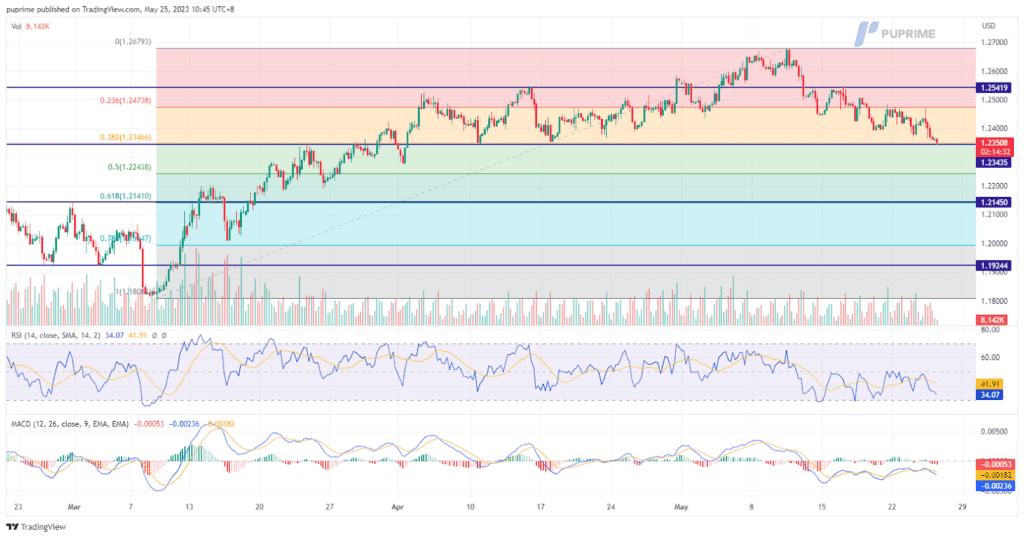
On Wednesday, the British pound initially rose due to the release of official data showing that Britain’s inflation rate fell by less than expected, while core price rises surged to a 31-year high. This raised the possibility of more interest rate hikes by the Bank of England. However, later in the day, the pound retraced its gains as the dollar strengthened. The dollar’s strength was driven by optimism surrounding the debt ceiling deal negotiations in the United States.
The pound’s price movement is currently testing a support level, indicating a potential opportunity for a technical rebound. Investors are advised to closely monitor the pound’s performance at this level as it could provide a favourable entry point.
Resistance level: 1.2540, 1.2680
Support level: 1.2345, 1.2145

The Dow experienced a decline as global financial markets witnessed a surge in risk-off sentiment due to mounting uncertainties. The release of the FOMC meeting minutes and the impasse in debt ceiling negotiations exacerbated market concerns. The minutes revealed a notable divergence of opinions among Federal Reserve officials regarding future interest rate hikes. While certain policymakers advocated for further tightening, others expressed apprehension about a potential economic slowdown that could potentially negate the need for additional monetary policy tightening. In the realm of debt ceiling negotiations, a consensus has yet to be reached, intensifying the cloud of uncertainty hovering over the US economy.
The Dow is trading lower while currently testing the support level. MACD has illustrated increasing bearish momentum, while RSI is at 35, suggesting the index might extend its losses after breakout since the RSI stays below the midline.
Resistance level: 34210, 35450
Support level: 32715, 31660
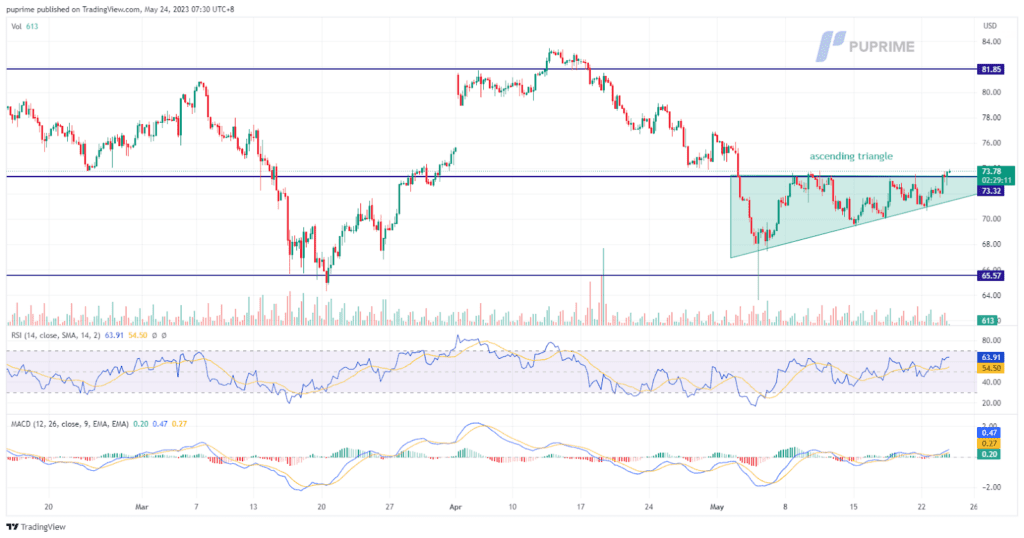
Oil prices rose 0.73% to $74.18 on an unexpected drop in US crude oil inventories, the largest decline since November, providing a bullish signal for the market. Additionally, Saudi Arabia’s warning to short sellers added to the upward momentum, suggesting a potential tightening of supply. Furthermore, market attention turned to the upcoming OPEC+ meeting, where discussions on production cuts are expected to take place. The anticipation of potential output reductions by OPEC and its allies heightened market speculation and fueled the rally in oil prices.
The oil price continued its upward momentum after successfully breaking out of its ascending triangle pattern. The breakout confirmed to market participants that the previous consolidation phase was likely ending, and the market was ready for a new leg of price appreciation. As a result, oil prices continued to climb, reflecting the positive market sentiment and the growing oil demand.
Resistance level: 76.88, 81.85
Support level: 73.32, 65.57

Trade forex, indices, metal, and more at industry-low spreads and lightning-fast execution.
Zarejestruj się na Live Account w PU Prime za pomocą naszego procesu bez żadnych kłopotów.
Bez wysiłku doładuj swoje konto za pomocą szerokiego zakresu kanałów i akceptowanych walut.
Uzyskaj dostęp do setek instrumentów w ramach wiodących na rynku warunków handlu
Please note the Website is intended for individuals residing in jurisdictions where accessing the Website is permitted by law.
Please note that PU Prime and its affiliated entities are neither established nor operating in your home jurisdiction.
By clicking the "Acknowledge" button, you confirm that you are entering this website solely based on your initiative and not as a result of any specific marketing outreach. You wish to obtain information from this website which is provided on reverse solicitation in accordance with the laws of your home jurisdiction.
Thank You for Your Acknowledgement!
Ten en cuenta que el sitio web está destinado a personas que residen en jurisdicciones donde el acceso al sitio web está permitido por la ley.
Ten en cuenta que PU Prime y sus entidades afiliadas no están establecidas ni operan en tu jurisdicción de origen.
Al hacer clic en el botón "Aceptar", confirmas que estás ingresando a este sitio web por tu propia iniciativa y no como resultado de ningún esfuerzo de marketing específico. Deseas obtener información de este sitio web que se proporciona mediante solicitud inversa de acuerdo con las leyes de tu jurisdicción de origen.
Thank You for Your Acknowledgement!